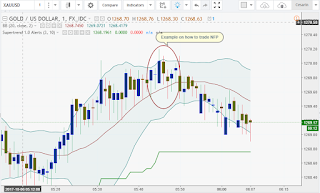
I will try to sum up in few steps the strategy that I posted for the last NFP release, working with the 1 min chart.
1. Stay on the 1 minute chart on data release without opening any position
2. Watch the first candle and write down the highest/lowest level of the candle
3. Watch the second candle to see if it reaches a level above/below the first candle.
4 Be ready to enter on the third candle: a) If the second candle reversed and the third candle did not surpass the first candle then enter long/short on the third candle and place a stop 2 pips above/below the highest/lowest level on the first candle.
5. Decide either to stay on your position and risk a small loss with the SL order being hit or to book profit on a USD 10 move in your direction.
I have attached a chart which shows an example of the 1 minute chart trade, in this case the initial reaction was up to 1270.21 on the first candle, then second candle only reached 1269.85 so the strategy would have been to sell the third candle @1269.5 with SL order @1272.21. If the initial reaction is down you just use the strategy going long on the third candle.
Disclosure: I´ll be buying between 1258 and 1262 depending on how strong the sell off is, with SL Order @1248, if the sell off is too strong then I will wait until the NY market open. If the market goes bullish after data release then I will buy @1273 with SL @1268. I would not chase the market if any of the SL orders is hit (either bullish or bearish) I would quit for the day. In any case the 1 minute chart strategy will be followed initially.

thanks sir cesar!
ReplyDeleteSo you will buy @1258 sir ?
ReplyDeleteWell, I bought already with SL order @1248.
ReplyDeleteNiceee, me too,
DeleteWhere is the best price for 1st tp sir ?
1274
Delete1274
ReplyDeleteThankyou sir cesar, is this still bearish for the next ? Or confrim for bullish sir?
DeleteWeekly charts need to continue developing for the upcoming periods, even though the daily chart ended up on a positive tone, only a close above 1281 next week will take the bearish pressure off the market.
DeleteBullish will only be confirmed with a break and weekly close above 1280
ReplyDeleteSir waiting for 90 from 2 week any view sir
ReplyDeleteWeekly charts need to continue developing for the upcoming periods, even though the daily chart ended upo on a positive tone, only a close above 1281 next week will take the bearish pressure off the market.
DeleteCommodities are the raw or primary product that could be satisfied the need like Soybean, gold silver and base metals.For more information CapitalHeight
ReplyDeleteThis is actually good to read content of this blog. A is very general and huge knowledgeable platform has been known by this blog. I in reality appreciate this blog to have such kind of educational knowledge.
ReplyDeleteCFD คือ